
In today’s competitive landscape, product innovation is only half the battle. The real differentiator lies in how companies test, validate, and communicate the superiority of their innovations to the market. A shoe company planning to launch two new sole materials faces this very challenge. The company believes the new soles will wear out more slowly than existing ones, but intuition and lab tests alone aren’t enough.
Customers demand proof, investors expect data-backed decisions, and competitors are quick to question unverified claims. This is where business analytics and statistical testing methods such as ANOVA (Analysis of Variance) come into play.
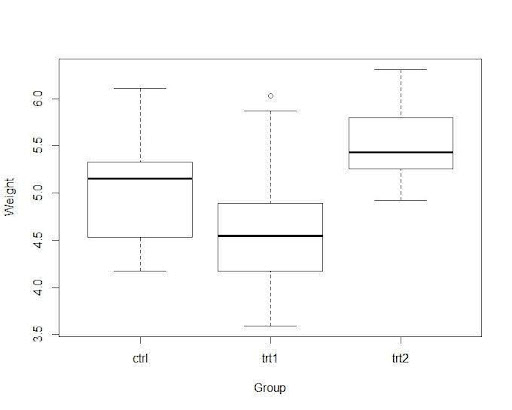
The company set up a structured experiment:
A random sample of consumers tested these shoes in real-life conditions. The company then measured wear and tear (in millimeters) after a fixed period. The dataset looked something like this:
GroupWear and Tear (mm)
Group 1
0.0001
Group 2
0.0003
Group 3
0.0005
Group 1
0.0000006
…
…
The big question:
👉 Are the observed differences in wear and tear truly due to the new materials? Or are they just random fluctuations?
This is where ANOVA becomes the consultant’s weapon of choice.
ANOVA is designed for exactly this scenario: testing whether there are statistically significant differences in group means when we have more than two groups.
If the data shows significant differences, the company can confidently say that at least one of the new materials truly performs better (or worse) than the old one.
Before jumping to conclusions, a consultant would remind the company of the three critical assumptions behind ANOVA:
If these conditions are violated, alternative methods like Kruskal-Wallis test (a non-parametric equivalent) might be used.
These examples show that across industries, the logic is the same: isolate true effects from random noise.
The shoe company’s case doesn’t exist in isolation. Let’s connect it to broader analytics trends shaping 2025:
Modern platforms can run thousands of micro-experiments simultaneously. Instead of manually running ANOVA, AI can auto-detect significant differences and flag patterns that humans may miss.
Example: Adidas uses AI to analyze wear-and-tear from smart insoles, feeding millions of data points into predictive models.
Companies now build digital replicas of products to simulate stress, wear, and customer behavior before real-world testing. While physical testing remains essential, digital twins narrow down the most promising candidates for ANOVA validation.
Wearable sensors in shoes can stream live data on stride, pressure, and wear. Instead of waiting for weeks, companies can observe degradation trends in real time and apply rolling ANOVA tests to detect early signals.
Beyond lab wear and tear, companies also analyze how customers perceive improvements. Sometimes a sole might last longer, but customers don’t feel the difference. Combining ANOVA with survey analytics bridges the gap between engineering improvements and customer satisfaction.
Imagine the company proves Material A is significantly more durable. The next question: How do we market it? This is where marketing mix analytics comes in—deciding whether to emphasize durability in digital campaigns, retail packaging, or influencer collaborations.
Here’s how I would summarize the roadmap for the client:
While our case focused on shoes, ANOVA’s applications are vast:
In each case, ANOVA helps separate signal from noise.
For the shoe company, ANOVA is more than a statistical test—it’s a decision-making compass. It allows leadership to move beyond gut feeling and base product launches on evidence.
In a world where consumers are skeptical, competitors are aggressive, and markets move fast, analytics ensures companies don’t gamble on innovation but instead launch with confidence.
The future will only deepen this reliance. AI, digital twins, and real-time analytics are making experimentation faster and sharper. Yet the principle remains the same: use data to validate hypotheses and guide strategy.
As consultants, our role is to translate these insights into business impact—turning numbers into narratives, and statistics into strategies. For the shoe company, the narrative is clear: if the data proves it, durability isn’t just a feature—it’s a selling story.
At Perceptive Analytics, our mission is “to enable businesses to unlock value in data.” For over 20 years, we’ve partnered with more than 100 clients—from Fortune 500 companies to mid-sized firms—to solve complex data analytics challenges. Our services include Power BI experts (see our Microsoft Power BI Developer & Consultant offering at perceptive-analytics.com) linking deep BI strategy with execution; tableau contractor services via our specialist Tableau engagements; and Excel expert in Boston support (through our Excel & VBA expertise) turning data into strategic insight. We would love to talk to you. Do reach out to us.